Analytics basics
Google Analytics for Beginners: The Complete GA4 Step-by-Step Guide
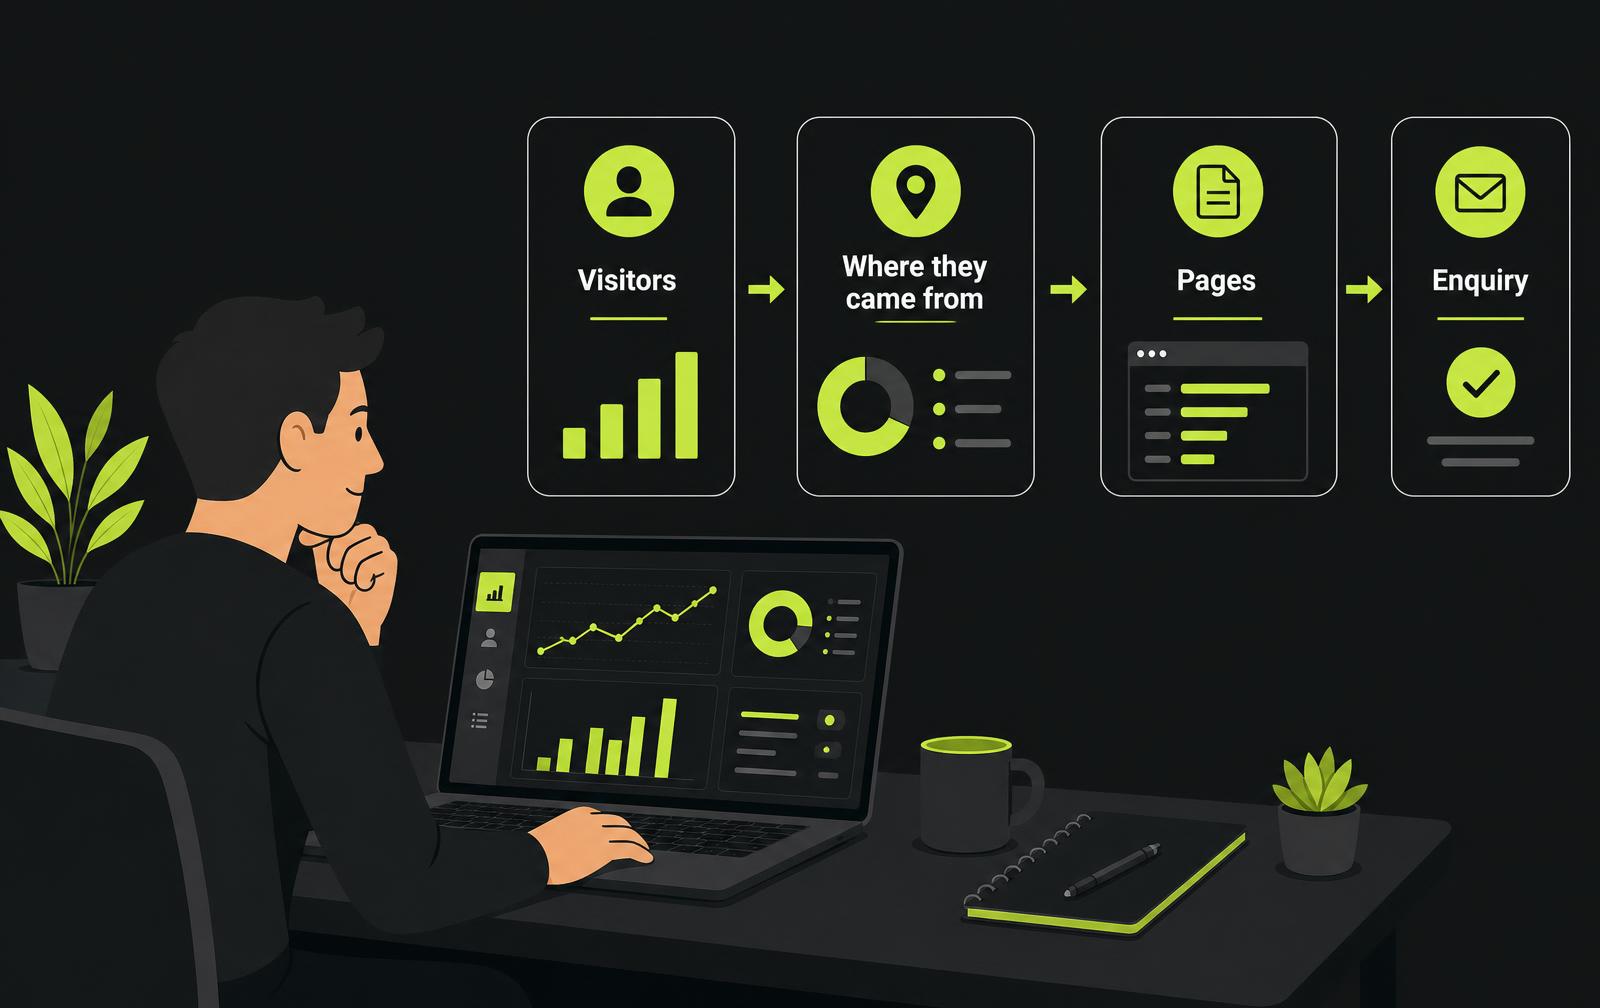
Google Analytics can show you an extraordinary amount of information about your website. The problem is that when you first open it, it feels like it was designed for analysts rather than small-business owners. The good news is that you don't need most of it.
For a small business, Google Analytics answers a handful of genuinely useful questions:
- How many people visit my website?
- Where do they come from?
- Which pages do they enter through?
- Which pages actually get used?
- Are visitors engaging, or leaving immediately?
- Which devices are they on?
- Which countries are visitors coming from?
- Are people completing important actions such as enquiries?
- Is my traffic improving?
This guide walks through those questions one at a time, in the order a complete beginner needs them. Nothing is assumed. Every term is explained the first time it appears.
- Difficulty
- Complete beginner
- Cost
- Free
- Platform covered
- Google Analytics 4 (GA4)
What is Google Analytics?
Google Analytics is a website and app measurement platform that helps you understand how people reach and use your website. Once correctly installed, it can show information such as visitor numbers, traffic sources, landing pages, engagement and important actions visitors complete.
The easiest way to keep the two Google tools straight: Search Console tells you how your website performs in Google Search. Google Analytics tells you what happens when people actually visit the website.
One piece of naming before we start. GA4 stands for Google Analytics 4, the current generation of Google Analytics. From here on, this guide uses "Google Analytics" and "GA4" to mean the same thing. If a guide you find elsewhere shows a completely different interface, it is almost certainly describing Universal Analytics, the older version that no longer exists.
Google Analytics vs Search Console: what is the difference?
These are two separate free Google tools, and mixing them up is the most common beginner confusion of all. Analytics measures your website. Search Console measures your presence in Google Search. Neither one replaces the other.
| Question | Google Analytics | Search Console |
|---|---|---|
| How many people used my website? | Yes | Only clicks that came from Google Search |
| Where did my visitors come from? | Yes — search, social, referral, email, paid, direct | Google Search only |
| What did people search on Google? | Only through linked Search Console reports | Yes |
| Which page did they enter through? | Yes — the Landing pages report | The pages that appeared in Google |
| Which pages did they view afterwards? | Yes | No |
| Did somebody submit an enquiry? | Yes, if it has been set up as a key event | No |
| Roughly what Google position did I appear at? | No | Yes |
For a business owner, the two work best together. If you have not set up the other one yet, our Google Search Console beginner's guide covers it from scratch in the same plain-English style.
How to set up Google Analytics 4 from absolute zero
Before the steps, it helps enormously to understand how Analytics is organised, because the setup wizard uses these four words and never explains them.
1. Account
The top level, and usually just your business. One account can hold several properties if you ever run more than one website.
2. Property
The thing being measured — normally your website. All your reports live inside the property, and it is what people mean when they say 'my GA4'.
3. Data stream
The connection sending information into the property. For a normal small business site you create one web data stream for your website address.
4. Google tag
The small piece of code on your website that actually sends the measurement information to Analytics. No tag, no data — however perfect the rest of the setup is.
In one sentence: an account contains a property, the property receives information from a data stream, and the data stream is fed by the Google tag on your website.
The setup walkthrough
- 1Go to the official Google Analytics service. Use Google's own address rather than any third-party page offering to set it up for you.
- 2Sign in with the Google account you want permanently associated with the business — one you will still control in five years, not a personal address belonging to a member of staff.
- 3Create an Analytics account if you do not already have one. Name it after the business, not after the website.
- 4Create a property. This is the thing that will hold your reports, so give it the name you will recognise in a list.
- 5Enter the business information Google asks for, and set the reporting time zone. UK businesses should choose the United Kingdom time zone and pounds sterling, otherwise your daily figures will be split across the wrong days.
- 6Create a web data stream and enter your website address, including https.
- 7Google then shows you your installation instructions and your Google tag. Follow whichever method matches how your website was built.
How the tag actually gets onto your site
There is no single answer, because it depends entirely on how your website was built. The tag may be added through a setting in your website platform, through a CMS integration or plugin, by pasting the Google tag into the site's code, through Google Tag Manager, or by your web developer. Not every website is WordPress, and the fastest route is usually to search your platform's own help for "Google tag".
Know when to stop
If the setup starts asking you to edit website code and that isn't something you normally do, stop. Send the measurement ID and Google's instructions to whoever manages the site. A tag pasted into the wrong place can break a page, and a tag installed twice will inflate every number you later look at.
The first thing to do after installing Analytics
Do not assume it worked. The Realtime report exists precisely so you can confirm that information is arriving, and it is the fastest sanity check available.
- 1Open your own website in one browser tab.
- 2Open Google Analytics in another tab and select the correct property.
- 3Go to Reports, then Realtime.
- 4Go back to your website and click through two or three pages.
- 5Return to Realtime and look for current activity in the last 30 minutes.
Good result
You appear as an active user, and the pages you visited show in the list. Analytics is receiving data. Standard reports are not instant in the same way, so do not worry if the main reports still look empty for the first day or so.
Nothing appears at all
Possible causes, roughly in order of likelihood:
- the tag is not installed, or was installed on a different page template
- your cookie banner is blocking analytics until consent is given, and you declined
- you are looking at the wrong property or the wrong data stream
- an ad blocker or privacy browser extension is stopping your own visit being recorded
- the tag was installed but the change was never published or saved
Google publishes its own troubleshooting guidance for missing data, linked in the sources at the end of this guide.
Before you start tracking visitors: a UK privacy note
This is not legal advice, and this section is deliberately short. But it matters, and it belongs before the fun part rather than after it.
Analytics works by storing and reading information on your visitor's device. In the UK, the Privacy and Electronic Communications Regulations — usually shortened to PECR — cover storing or accessing information on someone's device, and UK GDPR covers what you then do with personal data. The Information Commissioner's Office, the ICO, is the UK regulator that publishes guidance on both.
The ICO's finalised guidance on storage and access technologies (updated April 2026) includes a "statistical purposes" exception, also called the analytics exception: storage used solely to collect statistics about visitors, with a view to improving the service, may not need prior opt-in consent. Even then you must clearly tell people what the technology does and give them a simple, free way to object. Anything beyond that sole statistical purpose — advertising, cross-site tracking, personalisation, or sharing data with ad platforms — falls outside the exception and does require prior consent, and that consent must be as easy to refuse as it is to accept. GA4 in its default configuration is frequently used alongside Google advertising features, so many UK sites still gate it behind a consent banner. This is general information, not legal advice.
The practical rule
Make sure your cookie banner and privacy setup accurately reflect the analytics technology your website actually uses. If you're unsure about compliance, seek appropriate advice rather than copying another website's banner — a copied banner usually describes somebody else's tools.
One consequence worth knowing early: if your banner is set up correctly, your Analytics numbers will be lower than the true visitor count, because people who decline are not measured. That is expected. Do not go hunting for a way around it.
The GA4 reports that actually matter to a small business
GA4 has far more reports than a small business will ever open. Down the left-hand side you will find Home, Reports, Explore, Advertising and Admin. You can ignore Explore and Advertising entirely for now. Inside Reports, these are the ones that earn their keep:
Reports snapshot
The overview page. A quick glance at whether anything has changed dramatically.
Realtime
Who is on the site right now. Mainly useful for testing that things work.
Acquisition → Traffic acquisition
Where your visits came from. Probably the single most useful report in GA4 for a small business.
Engagement → Landing pages
Which pages people arrive on. The pages doing the actual work of bringing you visitors.
Engagement → Pages and screens
Which pages get viewed at any point during a visit.
Engagement → Events and Key events
What people did, and which of those actions you have flagged as important.
User attributes → Demographic details
Where in the world your visitors are.
Tech → Tech details
Phones versus computers, and which browsers people use.
That is eight reports out of dozens, and for most small businesses four of them will do almost everything. Interfaces do move around; if a menu name has changed since this was written, Google's current help pages are the authority.
Users, sessions, views and engagement: the numbers explained
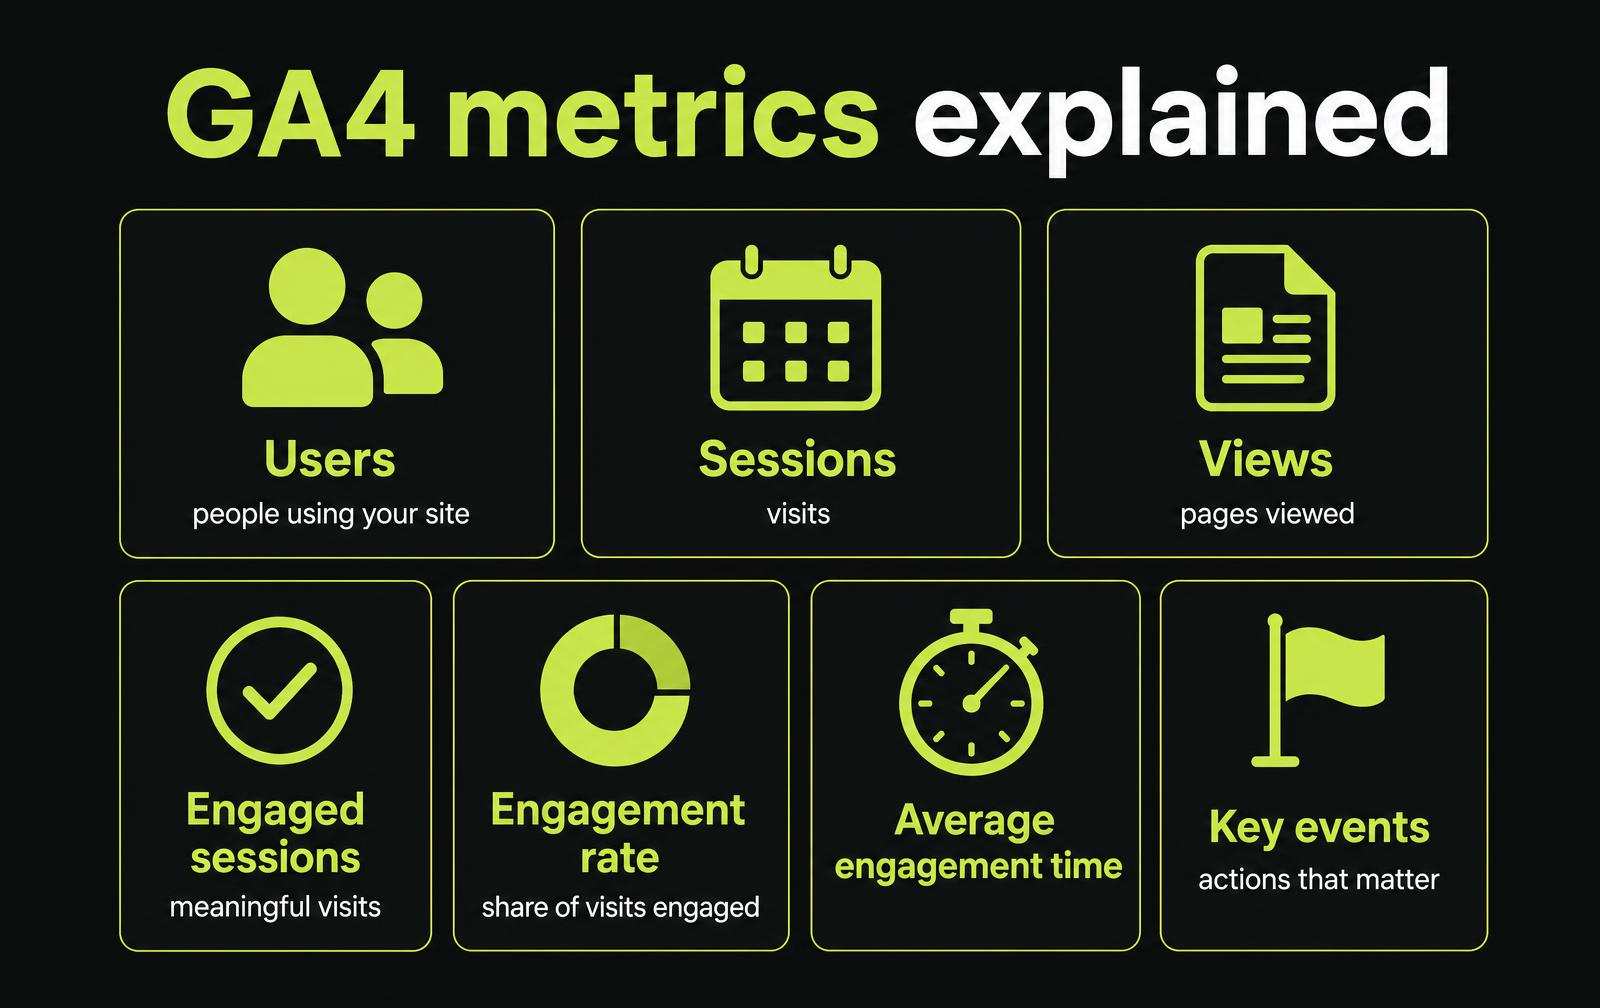
Seven numbers appear constantly in GA4. Understanding these makes almost every report readable, so this is the section worth reading twice.
Users / active users
Roughly how many separate people used your website in the period you are looking at.
Analytics counts devices and browsers rather than human beings. One person on a phone and a laptop can be counted twice, and someone who clears their cookies can be counted again next week. Treat it as a good estimate of scale, not a headcount.
Sessions
Visits. A session is one continuous period of somebody using your website.
One user can create several sessions. Someone who checks your prices on Monday and comes back on Thursday is one user and two sessions.
Views
The number of pages viewed, counting repeats.
If one visitor looks at four pages, that is one user, one session and four views. Views on their own tell you very little about whether the visit was any good.
Engaged sessions
Visits that GA4 judges to have gone somewhere rather than bouncing straight off.
Google's current criteria are that a session lasts longer than 10 seconds, or includes a key event, or includes at least two page or screen views. Any one of those is enough.
Engagement rate
The share of your sessions that counted as engaged.
If 100 sessions produce 55 engaged sessions, the engagement rate is 55%. It is a rough quality signal, not a verdict on the website.
Average engagement time
The average length of time your site was actually in the foreground of somebody's screen.
It ignores time when your tab was open but hidden behind something else, which makes it more honest than the old 'time on page' figures people used to quote.
Key events
The handful of actions you have told Analytics really matter to the business.
For most small businesses that means a completed enquiry form or a booking. This is the number that turns Analytics from interesting into useful.
500 visitors is not automatically better than 100
This is the mindset shift that makes Analytics useful rather than decorative. Consider two small business websites over the same month:
Website A
500 visitors, scattered across the world, arriving on unrelated blog articles. Zero enquiries.
Website B
100 visitors, nearly all local, arriving on service pages from relevant searches. Eight genuine enquiries.
Website B is winning by an enormous margin, and a report showing only total visitors would tell you the opposite. So when you look at Analytics, look at relevance, source, landing page, engagement and key events — not just the headline number.
The follow-on question, of course, is how to convert more of the good traffic. That is a subject in itself, and our guide on how to turn website visitors into customers covers it properly.
How to see where your website visitors come from
This is the report most business owners want first, and it is two clicks away.
- 1Open Reports in the left-hand menu.
- 2Open Acquisition.
- 3Choose Traffic acquisition.
- 4Set a sensible date range at the top right — the last 28 days is a good default.
- 5Read the first column, which lists your channels.
A channel is simply the broad category Analytics sorts each visit into. Here is what the common ones mean in plain English.
Organic Search
Somebody found you in the unpaid results of a search engine such as Google or Bing. For most small businesses this is the channel worth growing.
Direct
Analytics could not work out where the visit came from, so it filed it here. It does not automatically mean somebody typed your address in.
Referral
The visitor clicked a link on another website — a directory, a supplier, a local news piece, a forum.
Organic Social
Unpaid social media traffic, where Analytics recognised the platform. Some apps strip the information out, so social is often undercounted.
Paid Search
Traffic from paid search campaigns such as Google Ads, where the tracking is correctly in place.
Clicks from an email campaign, but only when the links were tagged so Analytics can recognise them.
Unassigned
Sessions that did not match any channel rule. A small amount is normal; a large amount usually points at a tagging problem.
Google's channel groupings do change over time, and you may see additional rows such as Cross-network or Paid Social depending on your marketing. The names in Google's current documentation always win over the names in any guide, including this one.
What Direct traffic actually means
Direct deserves its own section because almost everybody misreads it. Direct is not a measure of how famous you are. It is the bucket Analytics uses when it cannot work out where a session came from.
Things that commonly end up in Direct:
- Someone genuinely typing your address or using a bookmark
- A link clicked inside a PDF, a Word document or a desktop email programme
- A link opened from a messaging app that does not pass on the source
- A link where the tracking information was stripped for privacy reasons
- A visit that started on a secure page and moved to a non-secure one, or a redirect that lost the information
A small amount of Direct is normal on every website. A very large amount usually means something in your marketing is not tagged properly, and it is worth fixing, because untagged traffic cannot be judged.
Want more detail? Use session source / medium
Channels are the summary. Source and medium are the detail underneath.
- Source is where the visit came from — google, bing, facebook, a specific website.
- Medium is the type of traffic — organic for unpaid search, cpc for paid clicks, referral for links, email for tagged email.
Put them together and you get entries such as google / organic, which means unpaid Google search traffic, or google / cpc, which means you paid for those clicks. Two very different things that sit close together in a list.
- 1Open Reports, then Acquisition, then Traffic acquisition.
- 2Find the small dropdown at the top of the first column of the table.
- 3Change it from Session default channel group to Session source / medium.
- 4Read the list from the top: these are your real traffic sources, in order of size.
User acquisition vs traffic acquisition
You will see both reports side by side in the menu, and the difference is smaller than it looks. User acquisition reports on how new users first found you — the very first visit, credited to that original source. Traffic acquisition reports on the source of each session, including return visits.
If you're simply asking "where did my visits come from this month?", Traffic acquisition is the easier place for a beginner to start. Come back to User acquisition when you start caring about which channel introduces people to the business in the first place.
Which pages bring people into my website?
A landing page is the page where a website session begins. It is not a special type of page you have to build — it is simply whichever page somebody happened to arrive on. Find it under Reports, then Engagement, then Landing pages.
Read it looking for four things:
- Pages attracting a lot of sessions — these are your front doors, whether you designed them that way or not
- Pages attracting engaged sessions rather than just sessions
- Pages producing key events, once you have set those up
- Blog articles and service pages performing better than you expected, which tell you what to write more of
The most common surprise
Most small business owners assume the homepage is the main entrance. It usually isn't. A single well-targeted service page or blog article often brings in more first visits than the homepage does — which changes where your effort is best spent.
Which pages do visitors actually use?
The Pages and screens report, under Reports and then Engagement, lists every page that was viewed at any point in a visit — not just the first one.
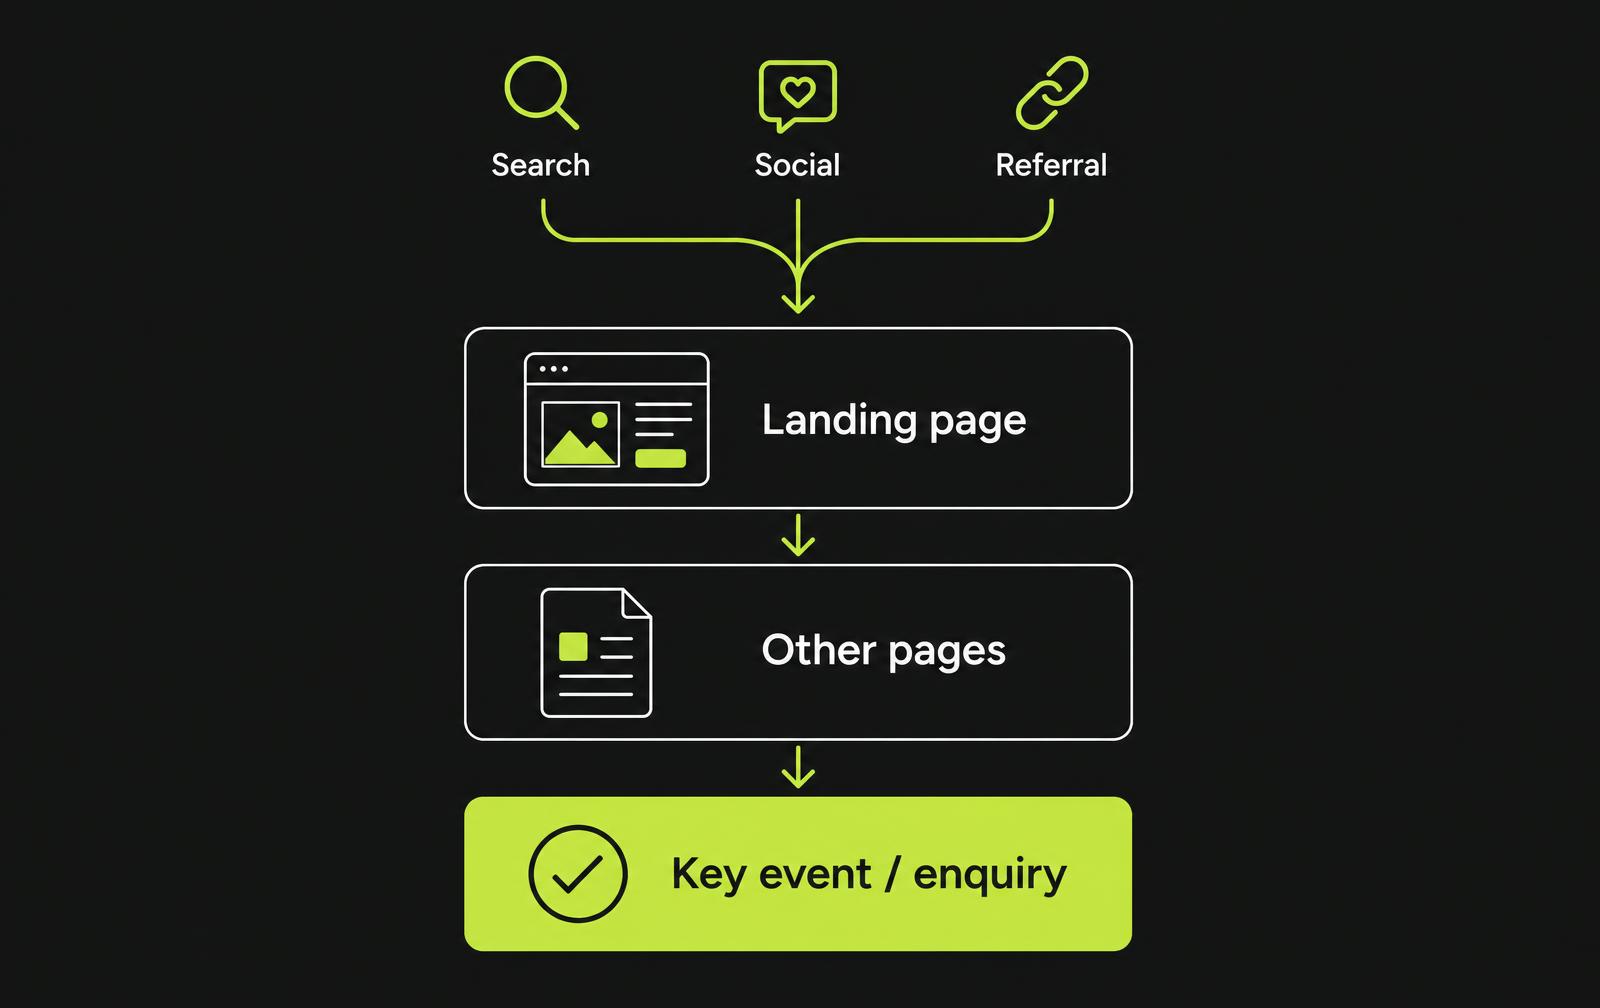
An example makes the distinction obvious. Say one visitor does this:
Google → Blog article → Pricing → Contact
Landing page: the blog article, because that is where the visit began.
Pages and screens: the blog article, pricing and contact — all three.
Use Landing pages to judge your marketing. Use Pages and screens to judge your website: it tells you which pages people actually bother to read once they are in the building. A pricing page appearing high in that list is usually a very good sign.
Where are my visitors located?
- 1Open Reports, then User, then User attributes.
- 2Choose Demographic details.
- 3In the table, set the first column to Country.
- 4Optionally add a comparison at the top so you can view the United Kingdom against everything else.
For a UK business serving a local area, this report answers a simple question: is my visibility reaching the people who could actually hire me?
Read it carefully
A visitor appearing to come from another country doesn't automatically mean they are a potential customer — or a bot. VPNs, expats, suppliers and holidaymakers all look foreign in this report. Look at traffic source and behaviour before drawing conclusions.
Why have I suddenly got loads of visitors from another country?
This is a common question from small-business website owners. Here is how to investigate it properly instead of guessing. Work through the steps in order and stop as soon as you have your answer.
- 1Filter or compare by that country in the Demographic details report, so you are only looking at the traffic in question.
- 2Check the city or region breakdown. A single city producing everything is different from traffic spread across a nation.
- 3Open Traffic acquisition with the same filter applied. Which channel did it come through?
- 4Change the dimension to Session source / medium. A real referral names a real website. A large amount of Direct can be a useful clue here, but Direct does not mean bot traffic.
- 5Check the landing pages. Genuine interest clusters around relevant pages; automated traffic often hits many unrelated URLs, or one odd URL repeatedly.
- 6Look at engagement. Average engagement time near zero across hundreds of sessions is a strong signal that no human was reading anything.
- 7Check whether any key events or enquiries occurred. If real enquiries came from it, it is real traffic — wherever it appears to be from.
Direct does not mean bots
A large amount of Direct traffic can be a useful clue when investigating unusual traffic, but Direct does not mean bot traffic. It simply means Google Analytics could not clearly identify another source for that session.
Do not judge by geography alone
A sudden cluster of direct visits across many unrelated URLs, with no meaningful engagement and no key events, may well deserve further investigation. But country on its own proves nothing. Plenty of UK customers browse behind a VPN, and plenty of genuine enquiries come from people who happen to be abroad that week.
The practical consequence is usually mild: junk traffic inflates your visitor count and depresses your engagement rate, which makes month-to-month comparison harder. It rarely harms the website itself. If it becomes persistent and large, that is the point to talk to your web developer about filtering it out.
Are visitors using phones or computers?
- 1Open Reports, then Tech, then Tech details.
- 2Set the first column of the table to Device category.
- 3Compare the rows for mobile, desktop and tablet.
This matters more than it sounds. For most local service businesses the majority of visitors arrive on a phone, often standing in the kitchen with the problem in front of them. If that is your split, the phone version of the site is the real website and the desktop version is the preview.
If mobile dominates, check these five things on an actual phone:
- Are the main buttons big enough to hit with a thumb, without zooming?
- Is the enquiry form short enough that filling it in on a phone is not a chore?
- Is your phone number tap-to-call, so one press starts the call?
- Does the page load quickly on mobile data rather than office wi-fi?
- Is the text readable without pinching, and does nothing scroll sideways?
Slow mobile loading in particular hurts twice: visitors leave, and Core Web Vitals are a real, if modest, factor in how Google treats the page.
What does "engagement" actually mean?
GA4 uses engagement instead of the old bounce rate, and it is a more honest measure. A session counts as engaged when it lasts longer than 10 seconds, or includes a key event, or includes at least two page or screen views. Any one of those three is enough.
That is deliberately generous, because a visit can be valuable without being long. Which leads to the important warning: high engagement is not automatically good, and low engagement is not automatically bad.
The plumber example
Somebody with a burst pipe lands on a plumber's website, sees the phone number in the header, and calls within eight seconds. Analytics records a short, unengaged session. The business records a job. The outcome matters more than the metric.
Use engagement as a comparison tool rather than a score: which landing pages hold attention, which traffic sources send people who actually read something, and which channels send visitors who vanish instantly.
What is an event in Google Analytics?
An event is something Analytics records happening on your website or app. In GA4 almost everything is an event, including the page view itself.
Events fall into a few groups, and you do not need to memorise them:
Automatically collected
Recorded as soon as the tag is installed, with no setup at all. The page view is the obvious one.
Enhanced measurement
Extra events GA4 can collect automatically if the option is switched on for the data stream — things like outbound link clicks, file downloads, site searches and scrolls.
Recommended
Events with names Google suggests using for common situations, so that reports stay consistent. Useful mainly if you sell online.
Custom
Events you or your developer define, for anything specific to your business — most often a successful enquiry form submission.
The practical takeaway: your website is probably already recording plenty of events. What it may not be doing is telling Analytics which of them represents money.
Key events, and how to know whether your website generates enquiries
A key event is an event that represents an action especially important to your business. Google renamed conversions to key events in the standard Analytics reports, which is why older guides and some Google Ads screens still say conversion.
For a small business, the realistic candidates are short:
- A successfully submitted enquiry form
- A booked consultation or appointment
- A completed quote request
- A purchase, if you sell online
An action is not the same as an outcome
A click on your phone number is an action, not a guaranteed lead — the call may never connect, and plenty of people tap a number by accident on a phone. Track it if it is useful, but don't treat it as an enquiry. The same goes for someone opening the contact page without ever submitting the form.
The beginner's lead-tracking checklist
- 1Decide what counts as a lead for your business. Write it down in one sentence — usually 'a completed enquiry form'.
- 2Make sure that action can actually be measured. Most forms show a thank-you message or redirect to a thank-you page; either can be tracked, but somebody has to set it up.
- 3Get the event firing. Depending on your website this may be a built-in setting, a plugin option, Google Tag Manager, or a small piece of code from your developer.
- 4Mark that event as a key event in the Admin area, so it appears as a column throughout your reports.
- 5Test it, then compare traffic sources and landing pages against key events rather than against visitor totals.
When to hand this over
If step three starts involving Google Tag Manager containers or code snippets, that is a perfectly sensible point to ask your web developer. It is normally a thirty-minute job for someone who has done it before, and getting it wrong quietly ruins the data you are about to base decisions on.
Test your key event before you trust it
- 1Send a genuine test enquiry through your own form, exactly as a customer would.
- 2Watch the Realtime report, or use the debugging tools your setup supports, and confirm the expected event arrives.
- 3Check in the Admin area that the event is marked as a key event.
- 4Wait a day and confirm it also appears in the standard reports, since those update on a delay.
- 5Repeat the test whenever the website or the form is changed.
Why this matters more than anything else here
A broken key-event setup makes a successful website look unsuccessful. We have seen businesses conclude their website "doesn't work" when in fact the enquiries were arriving by email all along and simply were not being recorded. Never assume tracking works just because Analytics is installed.
How much traffic does Google Search send me?
- 1Open Reports, then Acquisition, then Traffic acquisition.
- 2Find the Organic Search row in the channel table.
- 3Click it, or apply it as a filter, to see only unpaid search traffic.
- 4Check the landing pages and key events for that traffic specifically.
Analytics will tell you what those visitors did once they arrived. What it will not tell you is what they searched for to get there, because Google does not pass search terms into Analytics. For the actual queries, clicks, impressions and positions you need Google Search Console. If organic search is barely showing up at all, our guide to why your website may not be showing on Google is the right place to start, and the beginner's SEO tips cover the foundations.
How to connect Search Console to Google Analytics
Linking the two puts a limited set of search reports inside Analytics, so you can see organic search landing pages alongside everything else without switching tabs.
- 1In Google Analytics, open Admin.
- 2Find Product links, then Search Console Links.
- 3Choose Link, and select the Search Console property you own.
- 4Select the web data stream to associate it with, then review and submit.
- 5Publish the Search Console reports to your Reports menu if they do not appear automatically.
Permissions come first
Google requires the Editor role on the Analytics property and verified ownership of the Search Console property. If the link button does nothing useful, that is almost always a permissions issue rather than a fault — and it is a good reminder to check who actually owns these accounts for your business.
The link is a convenience, not a replacement. The full query data, the URL Inspection tool and every indexing report stay in Search Console.
How do I know whether an Instagram, email or campaign link worked?
By tagging the link before you share it. A tagged link carries a little extra text on the end that tells Analytics where the click came from. Those pieces of text are called UTM parameters, and you only need three of them.
https://yoursite.co.uk/offer?utm_source=instagram&utm_medium=social&utm_campaign=spring-offer
- utm_source — where you shared it: instagram, newsletter, partner-site.
- utm_medium — the type: social, email, cpc.
- utm_campaign — what the push was: spring-offer, may-newsletter.
The only real discipline required is consistency: pick lower-case names, use hyphens, and spell them the same way every time. Analytics treats Email and email as two separate things, which is how people end up with a fragmented mess six months later. Google provides an official campaign URL builder, linked in the sources.
One of the most important buttons in Analytics: the date range
It sits at the top right of every report and beginners almost never touch it. It is what turns a number into a trend.
- 1Click the date range at the top right of the report.
- 2Choose a sensible recent period — the last 28 days is a good default for a small business.
- 3Switch on the comparison option and choose the preceding period.
- 4For seasonal businesses, compare with the same period last year instead, once you have a year of data.
Looking at "today" tells you almost nothing. Small business websites have small numbers, and small numbers bounce around for reasons that have nothing to do with your marketing — a bank holiday, the weather, one busy Tuesday. Judge months against months.
10 questions every small business can answer with GA4
If you learn nothing else from this guide, learn where to click for these ten. Between them they cover almost every reasonable question an owner asks about their website.
| Question | Where to look |
|---|---|
| Is my website traffic increasing? | Reports → Reports snapshot, or Acquisition overview, with the date comparison switched on |
| Where do my visitors come from? | Reports → Acquisition → Traffic acquisition |
| How much of my traffic comes from Google? | Traffic acquisition, then read the Organic Search row |
| Which pages bring visitors in? | Reports → Engagement → Landing pages |
| Which pages get used most? | Reports → Engagement → Pages and screens |
| Are visitors mainly on mobile? | Reports → Tech → Tech details, with Device category selected |
| Are visitors from the country I actually serve? | Reports → User attributes → Demographic details, with Country selected |
| Which sources generate important actions? | Traffic acquisition, with the key events column |
| Which landing pages generate enquiries? | Landing pages report, with the key events column |
| Am I attracting relevant traffic or just more traffic? | Landing pages and Traffic acquisition, compared against key events rather than totals |
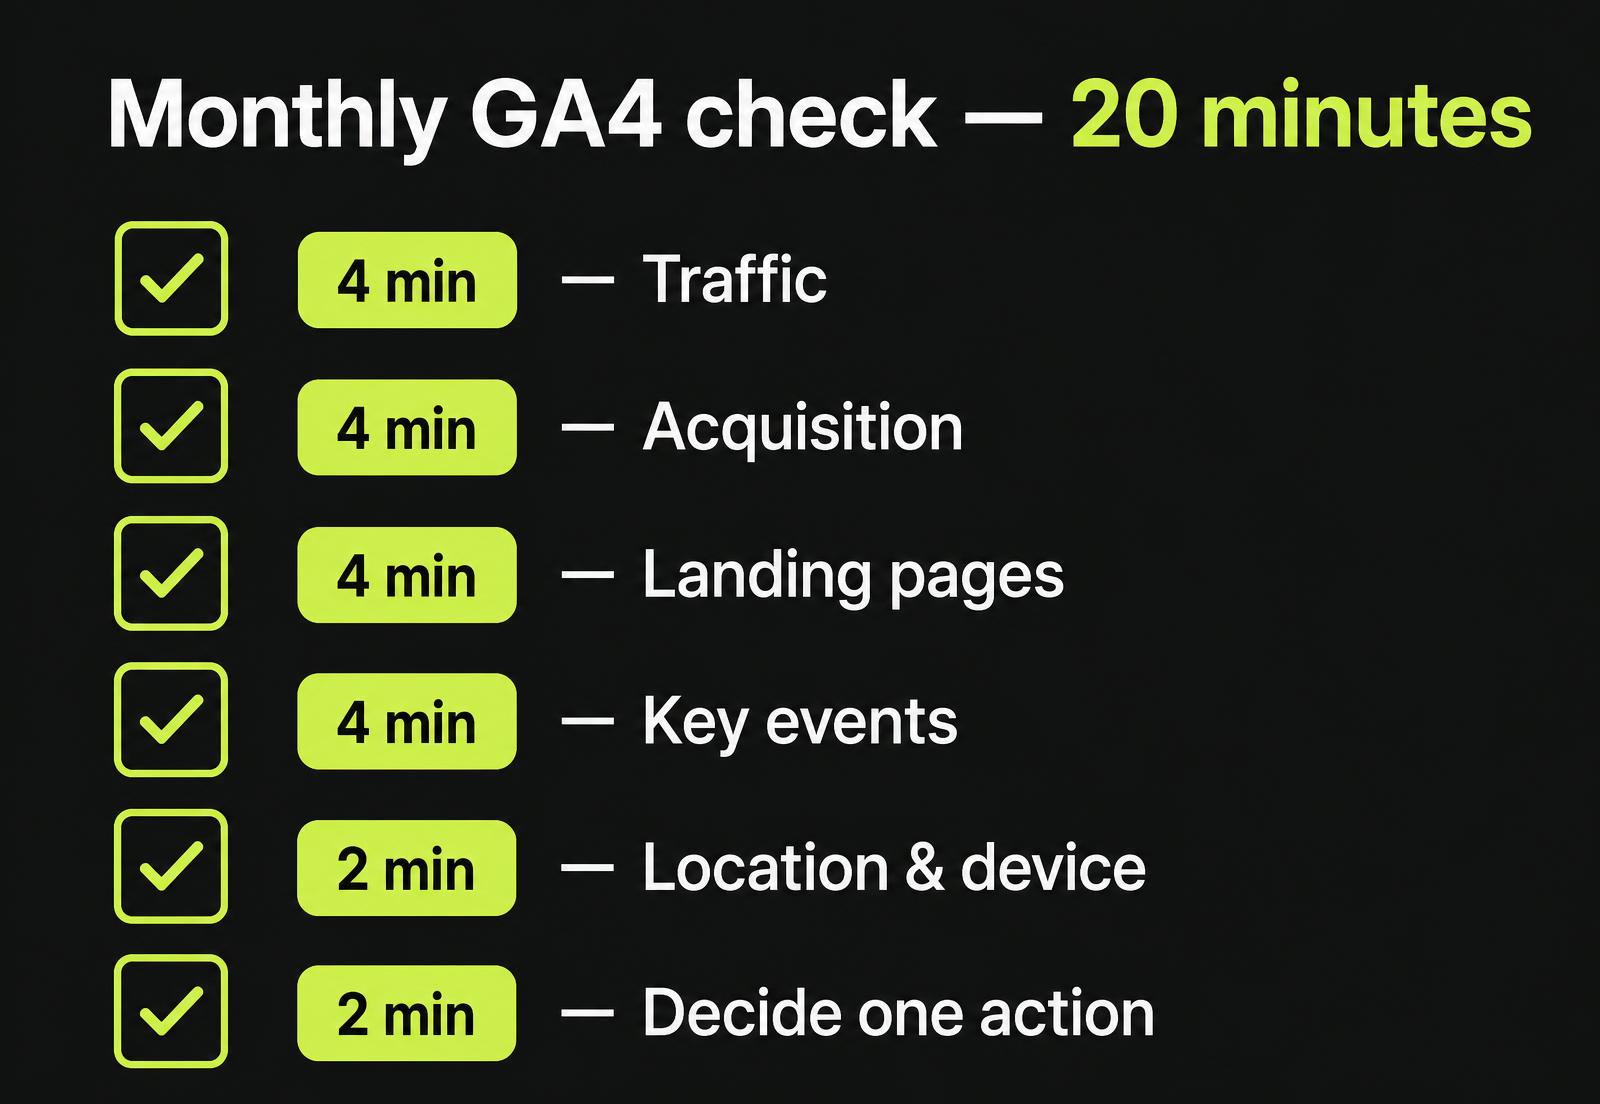
Your 20-minute monthly GA4 check
Twenty minutes, once a month, with a notebook open. Print this or keep it in your notes app.
The monthly routine
Printer friendly- 4 minutes
Traffic
How many users and sessions, compared with the previous period? Are the numbers relevant, or inflated by something odd?
- 4 minutes
Acquisition
Open Traffic acquisition. Which channels grew, which shrank, and did anything new appear?
- 4 minutes
Landing pages
Which entry pages brought people in, and which of them held attention?
- 4 minutes
Key events
Did meaningful actions happen, and which sources and pages produced them?
- 2 minutes
Location and device
Anything unusual in country or mobile-versus-desktop that deserves a closer look?
- 2 minutes
Decide one action
Improve a popular page, fix a mobile call to action, write more about a subject that worked, investigate a strange source, or add a clearer next step to a busy page with no enquiries. One thing, not ten.
What you're seeing, and what it might mean
These are possible interpretations, not certainties. Analytics shows you what happened; it never explains why. Use this table to decide where to look next rather than what to conclude.
| What you see | Possible interpretation | Next check |
|---|---|---|
| Traffic rising and enquiries rising | Something is working | Find which sources and landing pages grew, and do more of that |
| Traffic rising but no enquiries | The traffic may be the wrong kind, or the page may not be converting | Landing pages report alongside key events |
| Organic Search rising | Search visibility may be improving | Check Search Console for the searches behind it |
| A lot of Direct traffic | Attribution is unclear rather than everyone typing your address | Session source / medium and landing pages |
| A sudden overseas spike | Worth investigating rather than panicking | Country, then acquisition, then engagement |
| A popular page with no enquiries | A conversion opportunity rather than a failure | Look at the page's call to action and next step |
| Very little traffic at all | A visibility problem rather than an Analytics problem | Search Console, plus whatever marketing exists |
If the row you keep landing on is "rising traffic, no enquiries", the problem is usually on the page rather than in the analytics. Our guide to writing service pages that rank and the local SEO checklist for UK businesses are the two most useful next steps.
12 Google Analytics mistakes beginners make
- 1
Assuming users and sessions mean the same thing
They do not, and the gap between them is informative. Lots of sessions per user usually means people are coming back, which is generally a good sign.
- 2
Thinking Direct always means somebody typed the address
Direct is where Analytics puts sessions it could not attribute. Clicks from PDFs, apps, some email clients and stripped links all land there.
- 3
Treating every overseas visit as a bot
Some are. Some are UK people on a VPN, expats, or genuine enquiries. Look at the source and the behaviour before deciding.
- 4
Focusing only on the total visitor number
It is the easiest number to find and the least useful on its own. Relevance beats volume every single time for a small business.
- 5
Ignoring landing pages
The page people arrive on does most of the work of turning a visit into an enquiry. If you only ever look at one report, make it this one.
- 6
Never tracking a meaningful action
Without a key event, Analytics can tell you about visits and nothing about results. This is the single most common gap on small business setups.
- 7
Assuming every event is a key event
Analytics records dozens of things automatically. Only you can say which of them represents a real business outcome.
- 8
Never testing that lead tracking works
Send a test enquiry and confirm the event arrives. A broken setup makes a successful website look like a failure in the reports.
- 9
Changing strategy after one day of data
Small business websites have small numbers. A quiet Tuesday is weather, not a trend. Compare months, not mornings.
- 10
Ignoring mobile behaviour
If most of your visitors are on a phone, that is the version of the website that matters. Check the buttons, forms and phone numbers there first.
- 11
Confusing Search Console with Analytics
They answer different questions. Search Console covers what happened on Google; Analytics covers what happened on your website.
- 12
Collecting analytics without thinking about privacy rules
UK websites need to consider cookie and consent requirements. Set that up properly rather than copying another site's banner.
Glossary: every term in this guide
- GA4
- Google Analytics 4, the current generation of Google Analytics. When people say 'Analytics' today, this is what they mean.
- User
- A person using your website, as estimated by Analytics from devices and browsers rather than counted individually.
- Active user
- Google's main user metric for people who actively interacted with your website during the selected period. GA4 determines this using engagement and certain automatically collected activity, so treat it as an estimate of active visitors rather than a literal headcount of individual people.
- Session
- One visit. A continuous period of somebody using your website.
- View
- One page being viewed. Four pages in one visit is four views.
- Traffic source
- Where a visit came from — for example google, facebook, or a specific website.
- Medium
- The type of traffic — for example organic (unpaid search), cpc (paid), referral, or email.
- Channel
- The broad grouping Analytics sorts sources into, such as Organic Search or Referral.
- Organic search
- Visits from unpaid search results. Not adverts.
- Direct
- Visits Analytics could not attribute to a source. Not proof that somebody typed your address.
- Referral
- A visit that arrived by clicking a link on another website.
- Landing page
- The page where a visit began. Different from every other page they later viewed.
- Engagement
- GA4's measure of whether a visit went anywhere, based on time, views or a key event.
- Event
- Anything Analytics records happening on your site — a page view, a click, a form submission.
- Key event
- An event you have marked as especially important to the business, such as a completed enquiry.
- UTM parameter
- Extra text added to the end of a link so Analytics can tell where a click came from.
If you want to go further, the keyword research guide for small businesses explains how to choose what to write about, why local businesses need SEO covers why local search is usually the best use of a small budget, and the knowledge base and resources hub hold the rest of our guides.
And if the honest problem is that not enough people know you exist yet, our guide to promoting your business for free gives you 30 practical ways to fix that without an advertising budget.
Frequently asked questions
Sources
Every instruction above was checked against Google's own current Analytics documentation, and the privacy section against current ICO guidance. Interfaces change, so if what you see differs, the official pages are the authority.
- Google: Set up Analytics for a website
- Google: Set up a Google Analytics 4 property
- Google: Realtime report
- Google: Acquisition reports (user and traffic acquisition)
- Google: Default channel group definitions
- Google: Pages and screens report
- Google: User engagement metrics
- Google: About events
- Google: About key events
- Google: Link Search Console to Analytics
- Google: Collect campaign data with custom URLs (UTM)
- Google: Troubleshoot missing data / tag not detected
- ICO: Guidance on the use of storage and access technologies
Getting traffic but not enough enquiries?
Google Analytics can tell you that visitors are reaching your website. The next question is whether those visitors are turning into customers. Gee Web Design helps UK small businesses improve the pages, calls to action and SEO that turn useful traffic into real enquiries.